
Latest data released by the Islamic Republic of Iran Customs Administration show Iran’s exports totaled 186,294 tons worth $73.42 million during the month to April 20, indicating a 20.1% increase in tonnage and 9.58% decrease in value year-on-year.
Imports stood at 157,095 tons worth $79.55 million, up 60.98% in tonnage and down 58.72% in value YOY.
The Eastern European Group, also known as Countries with Economies in Transition, is one of the five unofficial Regional Groups in the United Nations that acts as voting blocs and negotiation forums, according to Financial Tribune.
Regional voting blocs were formed in 1961 to encourage voting to various UN bodies from regional groups. The group consists of countries in Eastern Europe, Balkans, Baltics, Central Europe and the Caucasus, which form the area of the former Eastern Bloc. Europe is divided between EEG and the Western European and Others Group. The group currently has 23 members.
The United Nations Regional Groups are the geopolitical regional groups of UN member states. These are divided into five regional groups: the African Group, with 54 member states, the Asia-Pacific Group, with 53 member states, the Eastern European Group, with 23 member states, the Latin American and Caribbean Group, with 33 member states, the Western European and Others Group, with 28 member states, plus 1 member state (the United States) as an observer state.
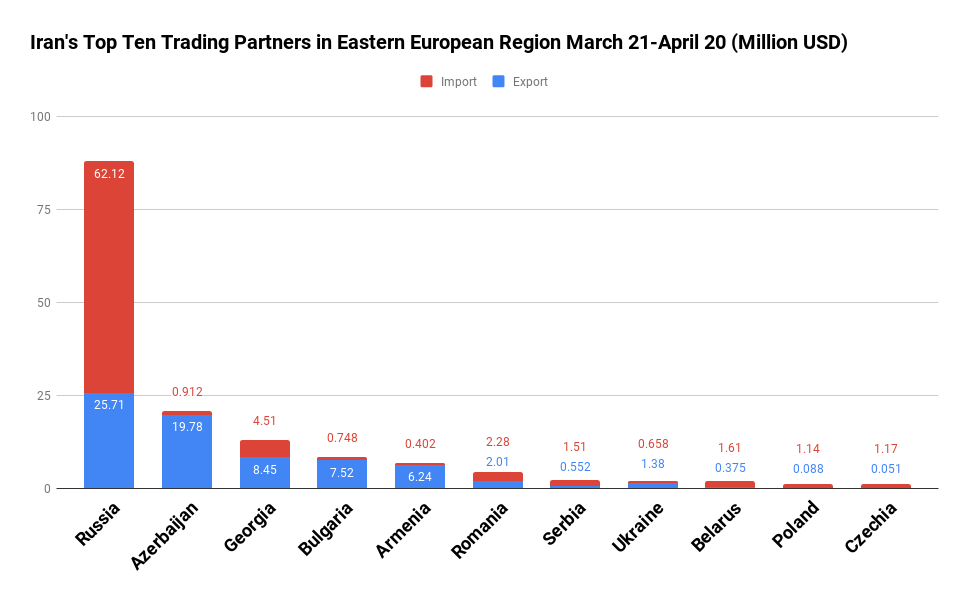
Main Commodities, Trading Partners
Iran mainly exported kiwi, tomatoes, polyethylene grade film, bitumen and cabbage to Eastern European.
In exchange, major commodities imported into Iran from member states included field corn, sunflower oil, barley, radio navigation devices and sheep carcasses.
In terms of total trade value, Russia topped the list among Eastern Europe countries with Iran trade standing at 213,886 tons worth $87.84 million, up by 48.45% in tonnage and down 54.61% in value YOY.
Exports to Russia amounted to 65,500 tons worth $25.71 million to register a 1.77% growth in tonnage and an 8.58% decline in value YOY.
Russia was Iran’s top export destination among the countries under review and 13th in the whole world.
In return, Russia exported 148,386 tons of commodities worth $62.12 million to Iran, up by 86.15% in tonnage and down 62.44% in value YOY.
The world’s largest country in terms of land area was the top exporter of goods to Iran in the Eastern European Group and 10th in the world.
Major Iranian commodities exported to Russia were kiwi, tomatoes, cabbage, pistachios and dairy products.
For its part, Russia mainly exported field corn, sunflower oil, barley and radio navigation devices to Iran.
Azerbaijan was Iran’s second biggest trading partner among Eastern European states during the 12 months, as two-way commercial exchanges stood at 34,837 tons worth $20.7 million to register an 11.63% and 2.7% decline in tonnage and value respectively YOY.
Iran exported 33,058 tons of goods worth $19.78 million to Azerbaijan, down by 11.28% and 2.68% in tonnage and value respectively YOY.
Azerbaijan was Iran’s second export destination in Eastern Europe and 14th in the world during the period.
Iran’s exports to Azerbaijan included machinery, potatoes and textiles.
The country imported 1,779 tons of commodities worth $912,722 from Azerbaijan, down 17.6% and 3.04% in tonnage and value respectively YOY, which mainly consisted of barley and sheep carcasses.
Azerbaijan was the eighth exporter of goods to Iran among the countries under review and 55th exporter to Iran in the world.
Georgia was Iran’s third major trading partner among the member states. Trade between Iran and Georgia amounted to 31,534 tons worth $12.96 million, indicating a 40.62% and 27.7% increase in tonnage and value respectively YOY.
Iran’s exports reached 29,458 tons worth $8.45 million, up 42.8% and 15.07% in tonnage and value respectively YOY, while Georgia’s exports to Iran were at 2,076 tons worth $4.51 million, up by 15.53% and 60.74% in tonnage and value respectively YOY.
Georgia was Iran’s third export destination as well as the third exporter of goods to Iran in the region. The country was Iran’s 22nd export destination and 31st exporter to Iran in the world.
Bitumen, mining machinery and float glass were Iran’s main goods exported to Georgia, while Georgia exported mainly yarn and wood to Iran.
Romania was the third major exporter of goods to Iran, after Russia and Georgia, in Eastern Europe and 39th in the world, as Iran imported 1,088 tons worth $2.28 million from Romania during the one-month period, up by 198.44% in tonnage and down 38.94% in value YOY.
Iran mainly imported pipes and profiles, sheep carcasses and vehicle shock absorbers from Romania.
Highest Growths, Declines in Trade
Trade with Croatia ($61,033), Latvia ($84,915) and Bulgaria ($8.27 million) saw the highest YOY growths of 13,167%, 158.89% and 64.28% respectively, while trade with Albania ($95,634), Lithuania ($16,732) and Ukraine ($2.04 million) witnessed the lowest declines of 94.69%, 91.13% and 76.01% respectively.
Iran’s exports to Croatia ($61,033), Belarus ($375,374) and Latvia ($84,915) saw the highest growths of 13,167%, 400.61% and 158.89% respectively, while exports to Slovenia ($62,268), Albania ($95,634) and Lithuania ($16,732) witnessed the highest declines of 97.07%, 94.69% and 91.13% respectively.
Imports from Georgia ($4.51 million), Bulgaria ($748,176) and Serbia ($1.51 million) saw the highest growths of 60.74%, 50.66% and 38.96% respectively, while imports from Ukraine ($658,115), Estonia ($164,536) and Russia ($62.12 million) witnessed the highest declines of 90.26%, 63.15%, 62.44% respectively.